
Chart 2D
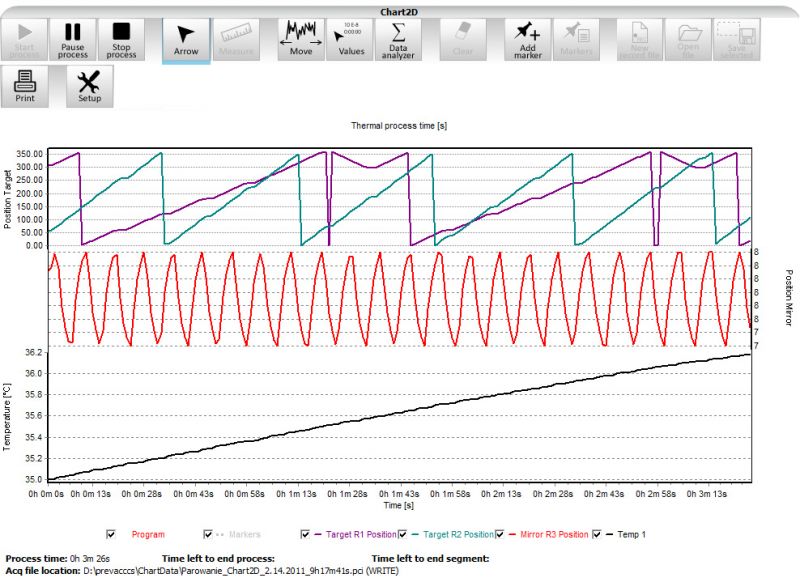
Chart 2D module give user access to see graphic representation of data in time. User can select which data he want to see, also has possibility to configure axes. Position, name and count of axes are free to configure and not limited. Data connected to selected axis can be draw with manual or automatic vertical ranges. All data can be zoom in and out. Chart 2D can represent data actual readed from the devices or load data previously saved on hard drive. This module during live representation of data can also storing all data “connected” to this chart (also data that are not at this moment drawing). There are many more function available inside the chart (like scrolling the data, turning on/off some visible data, adding markers, measure tool, printing tool and more).